[Tech] Taint Analysis

Taint Analysis Classification

  1. Explicit Analysis How taint propagates based on the data dependencies between variables.

  2. Implicit Analysis How taint propogates through condition instructions based on the control dependencies between variables.

Taint Analysis Tools
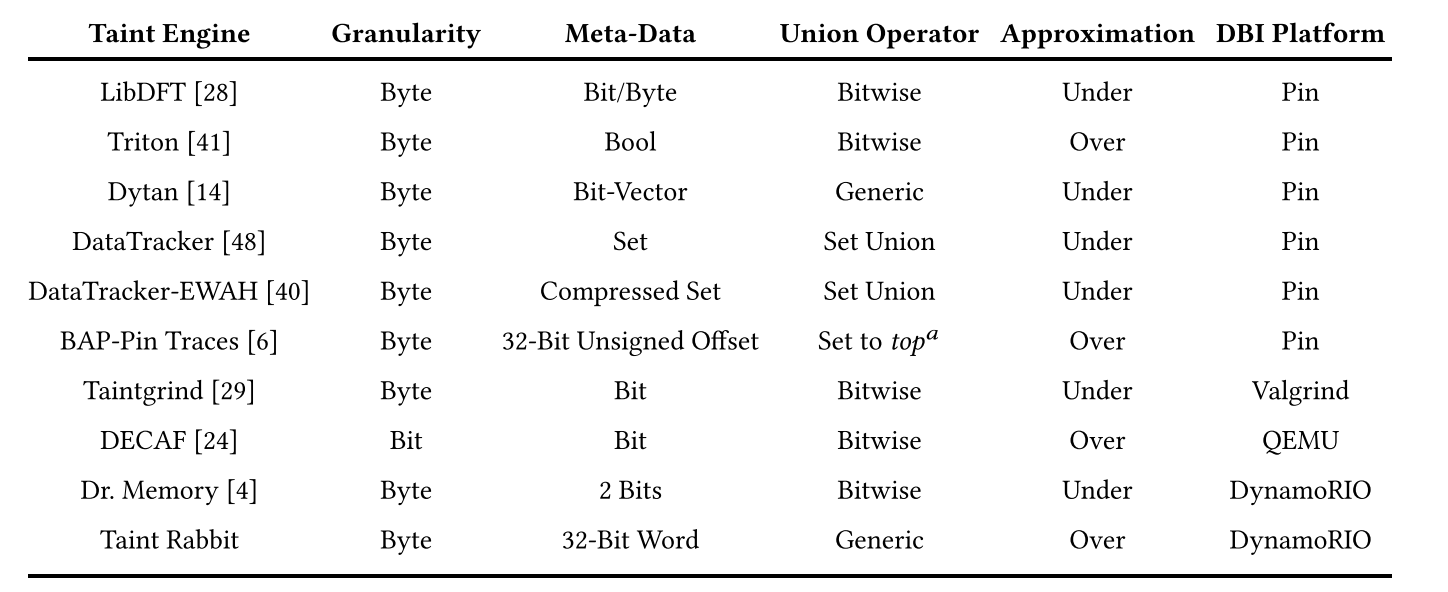
1. Taintgrind

github 动态分析工具

Valgrind is a dynamic instrumentation framework for building dynamic analysis tools, just like Pin. Taintgrind is built on the top of Valgrind, we need first to build and install Valgrind.

1
2
3
4
5
6
7
8
9
10
11
# build, install valgrind
wget -O https://sourceware.org/pub/valgrind/valgrind-3.16.0.tar.bz2
tar jxf valgrind-3.16.0.tar.bz2
mv valgrind-3.16.0 valgrind

cd valgrind
./autogen.sh
./configure --prefix=`pwd`/build

make
make install

Capstone is a disassembly framework with the target of becoming the ultimate disasm engine for binary analysis and reversing in the security community. Like many taint analysis tools, capstone is also needed by Taintgrind.

1
2
3
4
5
wget https://github.com/aquynh/capstone/archive/3.0.4.tar.gz -O capstone.tar.gz
tar xf capstone.tar.gz
sh configure_capstone.sh `pwd`/../build
cd capstone-3.0.4
sh make_capstone.sh

For the simple example test/sign32.c

1
2
3
4
5
6
7
8
9
10
11
12
13
14
#include "taintgrind.h"
int get_sign(int x) {
if (x == 0) return 0;
if (x < 0) return -1;
return 1;
}
int main(int argc, char **argv)
{
int a = 1000;
// Defines int a as tainted
TNT_TAINT(&a,sizeof(a));
int s = get_sign(a);
return s;
}

Run tool Taintgrind with Valgrind

1
2
3
4
../build/bin/valgrind --tool=taintgrind tests/sign32

# or simply
../build/bin/taintgrind tests/sign32

The output is of the form

1
2
Address/Location | Assembly instruction | Instruction type | Runtime value(s) | Information flow
0x108982: main (sign32.c:12) | mov eax, dword ptr [rbp - 0x50] | Load:4 | 0x3e8 | t15_9412 <- a:1ffeffff10

Taintgrind borrows the bit-precise shadow memory from MemCheck and only propagates explicit data flow. This means that Taintgrind will not propagate taint in control structures such as if-else, for-loops and while-loops. Taintgrind will also not propagate taint in dereferenced tainted pointers.

Regarding control-flow dependency and pointer dependence, please refer to https://github.com/wmkhoo/taintgrind/wiki/Control-flow-and-Pointer-tainting.

Taint file input example

1
./build/bin/taintgrind --file-filter=/home/wchenbt/Projects/Taint/valgrind/FAQ.txt ~/Projects/Taint/benchmark/gzip-1.6/build/bin/gzip -c FAQ.txt

2. Triton

github documentation (这个工具使用成本好像有点高,需要自己设置taint source)

既可以模拟执行静态分析,也能利用Python Binding动态运行分析结果

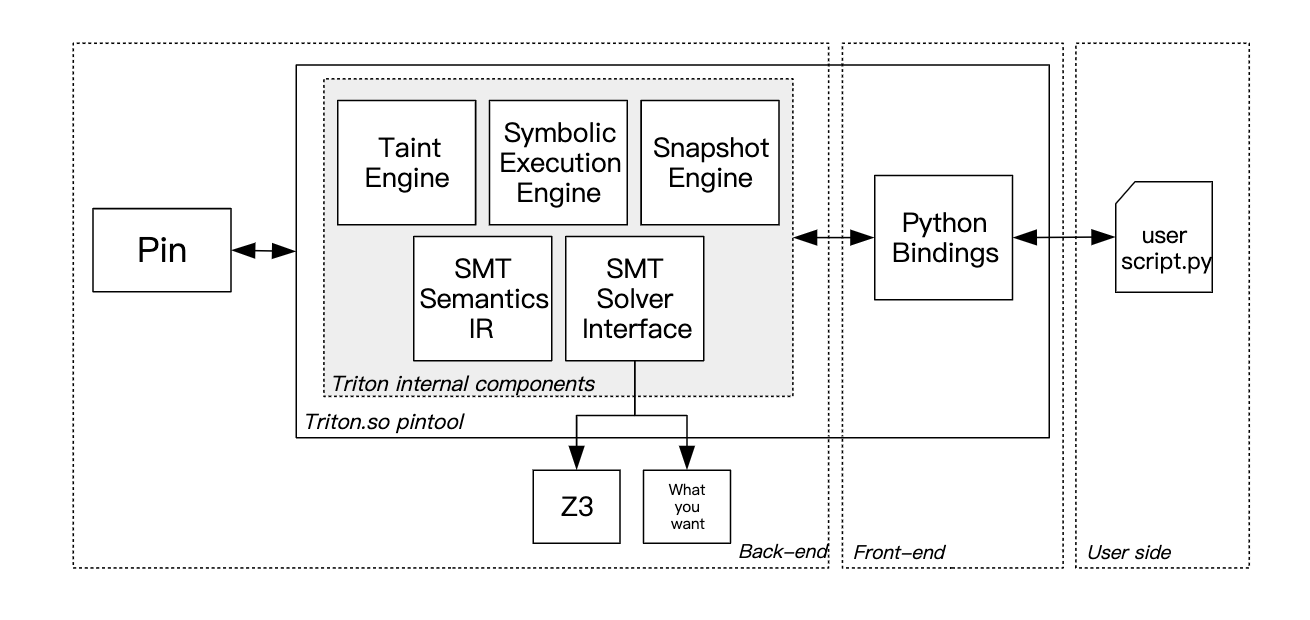
Triton is a Pin-based concolic execution framework that provides components like a taint engine, a dynamic symbolic execution engine, a snapshot engine, translation of x64 instruction into SMT2-LIB, a Z3 interface to solve constraints and Python bindings. Based on these components, you can build tools for automated reverse engineering or vulnerability research.

The Triton project itself generate an .so file to be used by python, an example is showed as below. tutorial

1
2
3
4
5
6
7
8
9
10
11
12
13
14
15
16
17
18
19
20
21
22
23
24
25
26
27
28
29
30
31
32
33
34
35
36
37
38
39
40
41
42
43
44
45
46
47
48
49
50
51
52
53
54
55
56
57
58
59
60
61
62
63
64
65
66
67
68
#!/usr/bin/env python
## -*- coding: utf-8 -*-
##
## Output:
##
## $ python src/examples/python/disass.py

from __future__ import print_function
from triton import TritonContext, ARCH, Instruction, OPERAND

import sys

code = [
(0x40000, b"\x40\xf6\xee"), # imul sil
(0x40003, b"\x66\xf7\xe9"), # imul cx
(0x40006, b"\x48\xf7\xe9"), # imul rcx
(0x40009, b"\x6b\xc9\x01"), # imul ecx,ecx,0x1
(0x4000c, b"\x0f\xaf\xca"), # imul ecx,edx
(0x4000f, b"\x48\x6b\xd1\x04"), # imul rdx,rcx,0x4
(0x40013, b"\xC6\x00\x01"), # mov BYTE PTR [rax],0x1
(0x40016, b"\x48\x8B\x10"), # mov rdx,QWORD PTR [rax]
(0x40019, b"\xFF\xD0"), # call rax
(0x4001b, b"\xc3"), # ret
(0x4001c, b"\x80\x00\x01"), # add BYTE PTR [rax],0x1
(0x4001f, b"\x64\x48\x8B\x03"), # mov rax,QWORD PTR fs:[rbx]
]


if __name__ == '__main__':

Triton = TritonContext()

#Set the arch
Triton.setArchitecture(ARCH.X86_64)

for (addr, opcode) in code:
# Build an instruction
inst = Instruction()

# Setup opcode
inst.setOpcode(opcode)

# Setup Address
inst.setAddress(addr)

# Process everything
Triton.processing(inst)

# Display instruction
print(inst)
print(' ---------------')
print(' Is memory read :', inst.isMemoryRead())
print(' Is memory write:', inst.isMemoryWrite())
print(' ---------------')
for op in inst.getOperands():
print(' Operand:', op)
if op.getType() == OPERAND.MEM:
print(' - segment :', op.getSegmentRegister())
print(' - base :', op.getBaseRegister())
print(' - index :', op.getIndexRegister())
print(' - scale :', op.getScale())
print(' - disp :', op.getDisplacement())
print(' ---------------')

print()

sys.exit(0)

Pin is a dynamic binary instrumentation framework for the IA-32, x86-64 and MIC instruction-set architectures that enables the creation of dynamic program analysis tools, there is a tutorial of Pin for us tutorial to refer to.

This project is also shipped with a Pintool tracer and may be compiled with these following commands:

1
2
3
4
5
6
7
8
9
10
11
12
13
14
15
16
17
18
19
20
21
22
23
24
# get and install the latest z3 relesae   
git clone https://github.com/Z3Prover/z3.git && cd z3
CC=clang CXX=clang++ python scripts/mk_make.py
cd build && make && sudo make install

# Install capstone
curl -o cap.tgz -L https://github.com/aquynh/capstone/archive/3.0.4.tar.gz
tar xvf cap.tgz && cd capstone-3.0.4/ && sudo ./make.sh install

# Install pintool
curl -o pin.tgz -L http://software.intel.com/sites/landingpage/pintool/downloads/pin-2.14-71313-gcc.4.4.7-linux.tar.gz
tar zxf pin.tgz

# Install Triton (Python Binding)
cd pin-2.14-71313-gcc.4.4.7-linux/source/tools/
git clone https://github.com/JonathanSalwan/Triton.git
cd Triton && mkdir build && cd build
cmake -G "Unix Makefiles" -DPINTOOL=on -DKERNEL4=on -DPYTHON36=off ..
make -j2
sudo make install

# test Triton PinTool
cd ..
./build/triton ./src/examples/pin/ir.py /usr/bin/id

There are several tutorials about the usage of python bindings. The interface in this tutorial1 is quite old, the high-level ideas should be ok, but please refer to the src/examples and toturial2 for the correct usage. Also attach tutorial3 here for reference.
Here is an example to count the number of executed instructions using PinTool.

1
2
3
4
5
6
7
8
9
10
11
12
13
14
15
16
17
18
19
20
21
22
23
24
#!/usr/bin/env python2
## -*- coding: utf-8 -*-

from pintool import *
from triton import ARCH

count = 0

def mycb(inst):
global count
count += 1

def fini():
print("Instruction count : ", count)

if __name__ == '__main__':
ctx = getTritonContext()
# for better performance, disable symbolic execution and taint analysis
ctx.enableSymbolicEngine(False)
ctx.enableTaintEngine(False)
startAnalysisFromEntry()
insertCall(mycb, INSERT_POINT.BEFORE)
insertCall(fini, INSERT_POINT.FINI)
runProgram()

Run the above program and check the output.

1
2
➜  Triton git:(master) ✗ ./build/triton src/examples/pin/count_inst.py src/samples/crackmes/crackme_xor
('Instruction count : ', 914)

The example of performing taint analysis for a specfic program is shown as below.

1
2
3
4
5
6
7
8
9
10
11
12
13
14
15
16
17
18
19
20
21
22
23
24
25
26
27
28
29
30
31
32
33
34
35
#!/usr/bin/env python2
# -*- coding: utf-8 -*-
from triton import ARCH, MemoryAccess, OPERAND
from pintool import *

Triton = getTritonContext()
def cbeforeSymProc(instruction):
if instruction.getAddress() == 0x400556:
rdi = getCurrentRegisterValue(Triton.registers.rdi)
# 内存要对齐
Triton.taintMemory(MemoryAccess(rdi, 8))


def cafter(inst):
if inst.isTainted():
# print('[tainted] %s' % (str(inst)))

if inst.isMemoryRead():
for op in inst.getOperands():
if op.getType() == OPERAND.MEM:
print("read:0x{:08x}, size:{}".format(
op.getAddress(), op.getSize()))

if inst.isMemoryWrite():
for op in inst.getOperands():
if op.getType() == OPERAND.MEM:
print("write:0x{:08x}, size:{}".format(
op.getAddress(), op.getSize()))


if __name__ == '__main__':
startAnalysisFromSymbol('check')
insertCall(cbeforeSymProc, INSERT_POINT.BEFORE_SYMPROC)
insertCall(cafter, INSERT_POINT.AFTER)
runProgram()

The order of executed inserted callback is listed as below:

1
2
3
4
5
BEFORE_SYMPROC
ir processing, perform taint analysis and symbolic execution
BEFORE
Pin ctx update, execute the instruction,modify the runtime info in TritonContext
AFTER

3. Pyre

github 针对python的类型检查和静态分析工具

1
2
3
4
5
6
7
8
9
mkdir my_project && cd my_project
python3 -m venv ~/.venvs/venv
source ~/.venvs/venv/bin/activate
(venv) $ pip install pyre-check==0.0.52
(venv) $ pyre init
(venv) $ echo "i: int = 'string'" > test.py
(venv) $ pyre
ƛ Found 1 type error!
test.py:1:0 Incompatible variable type [9]: i is declared to have type `int` but is used as type `str`.

Pyre ships with Pysa, a security focused static analysis tool we've built on top of Pyre that reasons about data flows in Python applications. Please refer to the documentation to get started with security analysis.

4. Psalm

github 针对php的静态分析工具

1
2
3
4
5
6
7
8
9
# install composer
curl -sS https://getcomposer.org/installer -o composer-setup.php
sudo php composer-setup.php --install-dir=/usr/local/bin --filename=composer
# check
composer

#install psalm
sudo apt-get install php7.2-xml
composer require --dev vimeo/psalm

5. LibDFT

基于Pin的动态分析工具 source for x86

1
2
3
4
5
wget https://www.cs.columbia.edu/~vpk/research/libdft/libdft-3.1415alpha.tar.gz

export PIN_HOME=..../pin-2.14
cd ..../libdft/libdft_linux-i386/src && make
cd ..../libdft/libdft_linux-i386/tools && make tools

source for x86_64 used by Angora

1
2
3
4
5
6
7
8
9
10
git clone https://github.com/AngoraFuzzer/libdft64.git

cd libdft64
mkdir build
PREFIX=`pwd`/build ./install_pin.sh
# change wget to curl like below
# curl -o ${TAR_NAME}.tar.gz -L https://software.intel.com/sites/landingpage/pintool/downloads/${TAR_NAME}.tar.gz

export PIN_ROOT=..../libdft64/build/pin-3.7-97619-g0d0c92f4f-gcc-linux
make

6. Bincat or Ponce

IDA插件 静态分析工具 github

BinCAT is a static Binary Code Analysis Toolkit, designed to help reverse engineers, directly from IDA or using Python for automation.

https://airbus-seclab.github.io/bincat/RECON-MTL-2017-bincat-biondi_rigo_zennou_mehrenberger.pdf

7. PolyTracker

github 动态分析 binary tree (二叉森林?)

Polytracker is an LLVM pass that instruments the programs it compiles to track which bytes of an input file are operated on by which functions. It outputs a JSON file containing the function-to-input-bytes mapping.

The blog instroduce Polytracker and PolyFile https://blog.trailofbits.com/2019/11/01/two-new-tools-that-tame-the-treachery-of-files/.

8. Tigress

https://github.com/JonathanSalwan/Tigress_protection

9. DECAF/DECAF++

10. TaintInduce

https://taintinduce.github.io/

11. DFSan

12. Doop

Android https://bitbucket.org/yanniss/doop/src/master/

Pyt https://github.com/python-security/pyt

Pixy https://github.com/oliverklee/pixy

Phosphor github taint analysis for JVM

Neuzz/NeuTaint github paper

Dytan 找不到GitHub 嘤嘤嘤 备用github github2 基于Pin

DataTracker github

DataTracker-EWAH github used by Vuzzer

DFSan github

Taintdroid

FlowDroid https://blogs.uni-paderborn.de/sse/tools/flowdroid/

Apposcopy

Scandroid

[ISSTA'11] Saving the World Wide Web from Vulnerable JavaScript https://dl.acm.org/doi/pdf/10.1145/2001420.2001442

[PLDI'09] TAJ: effective taint analysis of web applications https://dl.acm.org/doi/10.1145/1542476.1542486

[FSE'19] Nodest: feedback-driven static analysis of Node.js applications

Bap https://github.com/BinaryAnalysisPlatform/bap