Usages and problems of Taint Tools
1. Tool Categories
Existing taint analysis tools can be divided into three categories.
a. Dynamic Taint Analysis
The first category of tools track the information flow from taint
source to taint sink at runtime following the execution trace. Most of
these dynamic analysis tools are built on the top of dynamic binary
instrumentation (DBI) framework such as Pin and Valgrind. These tools
dynamically insert analysis code into the target executable while the
executable is running. Some other tools like PolyTracker work as an LLVM
Pass that instruments taint tracking logic into the programs during
compilation to perform taint analysis with lower overhead. Such tools
always ship with their own compiler, for example, polybuild
and polybuild++ of Tool PolyTracker. Given a specific
input, the dynamic analysis tools will track how the taint is propagated
along the executed path.
| Tools | Foundation | Data Dependency |
|---|---|---|
| Dytan | DBI Platform: Pin | Explicit and Implicit |
| Triton | DBI Platform: Pin | Explicit |
| LibDFT | DBI Platform: Pin | Explicit |
| LibDFT64 | DBI Platform: Pin | Explicit |
| Taintgrind | DBI Platform: Valgrind | Explicit |
| DataFlow Sanitizer | LLVM Pass | |
| PolyTracker | LLVM Pass | Explicit and Implicit |
| TaintInduce |
b. Static Taint Analysis but Emulate the Execution
The second category of tools work as an interpreter or a CPU emulator, which means these tools do not execute the target program, but emulate the functionalities and collect the essential information for analysis. Usually, we need to set up the environment such as stack, heap, the content of memory, and program input before performing analysis. During analysis, these tools process machine code one by one and transform the code into their pre-defined intermediate language, then the memory and register will be manipulated based on the intermediate language, with the taint propagated at the same time. At each program point during execution, the value of registers and memory cells can be monitored to check if they are tainted or not. As we can see, tools in this category also maintain an execution trace and only take care of the data and instructions along this execution trace, which is the same as dynamic taint analysis.
| Tools | Description | Data Dependency |
|---|---|---|
| Bincat | Plugin for IDA | Explicit |
| Triton | Convert instruction to IR to emulate execution | Explicit |
c. Static Taint Analysis
The third category of tools analyze the target program statically and
wholly. All paths are taken into consideration. The taint source and
sink are specified using annotations. Generally speaking, the sources
are the return value of user-controllable functions, like
input(), and the sinks are the parameters of functions that
should be treated carefully or may lead to potential security issues,
like os.command(). The tracking granularity of tools in
this category is quite larger compared with the two before mentioned.
Except for the taint source and sink, the tools in this category also
support for sanitizing functions. Especially, Psalm, a tool mainly
aiming for security analysis of web applications, will automatically
remove the taint from data when executing functions like
stripslashes, which removes backslashes used to prevent
cross-site-scripting attacks.
| Tools | Description | Data Dependency |
|---|---|---|
| Pysa | reasons about data flows in Python applications | Explicit |
| Psalm | find errors in PHP applications | Explicit |
In the following sections, I will demonstrate the usage of several tools to illustrate the difference between these three kinds of tools. In the end, with the guidance of the idea that if the output changes with the different inputs, the output should be tainted once the input is tainted, I will show the potential difficulties in testing these analysis tools.
2. Dynamic Analysis Tool: Taintgrind
This tool Taintgrind is built on the top of Valgrind. There are two
ways to track taint. One is using TNT_TAINT client request
to introduce taint into a variable or memory location in the program.
Take the following program as an example, we taint variable
a, then pass it to get_sign function. The
return value of get_sign implicitly depends on the
parameter.
1 |
|
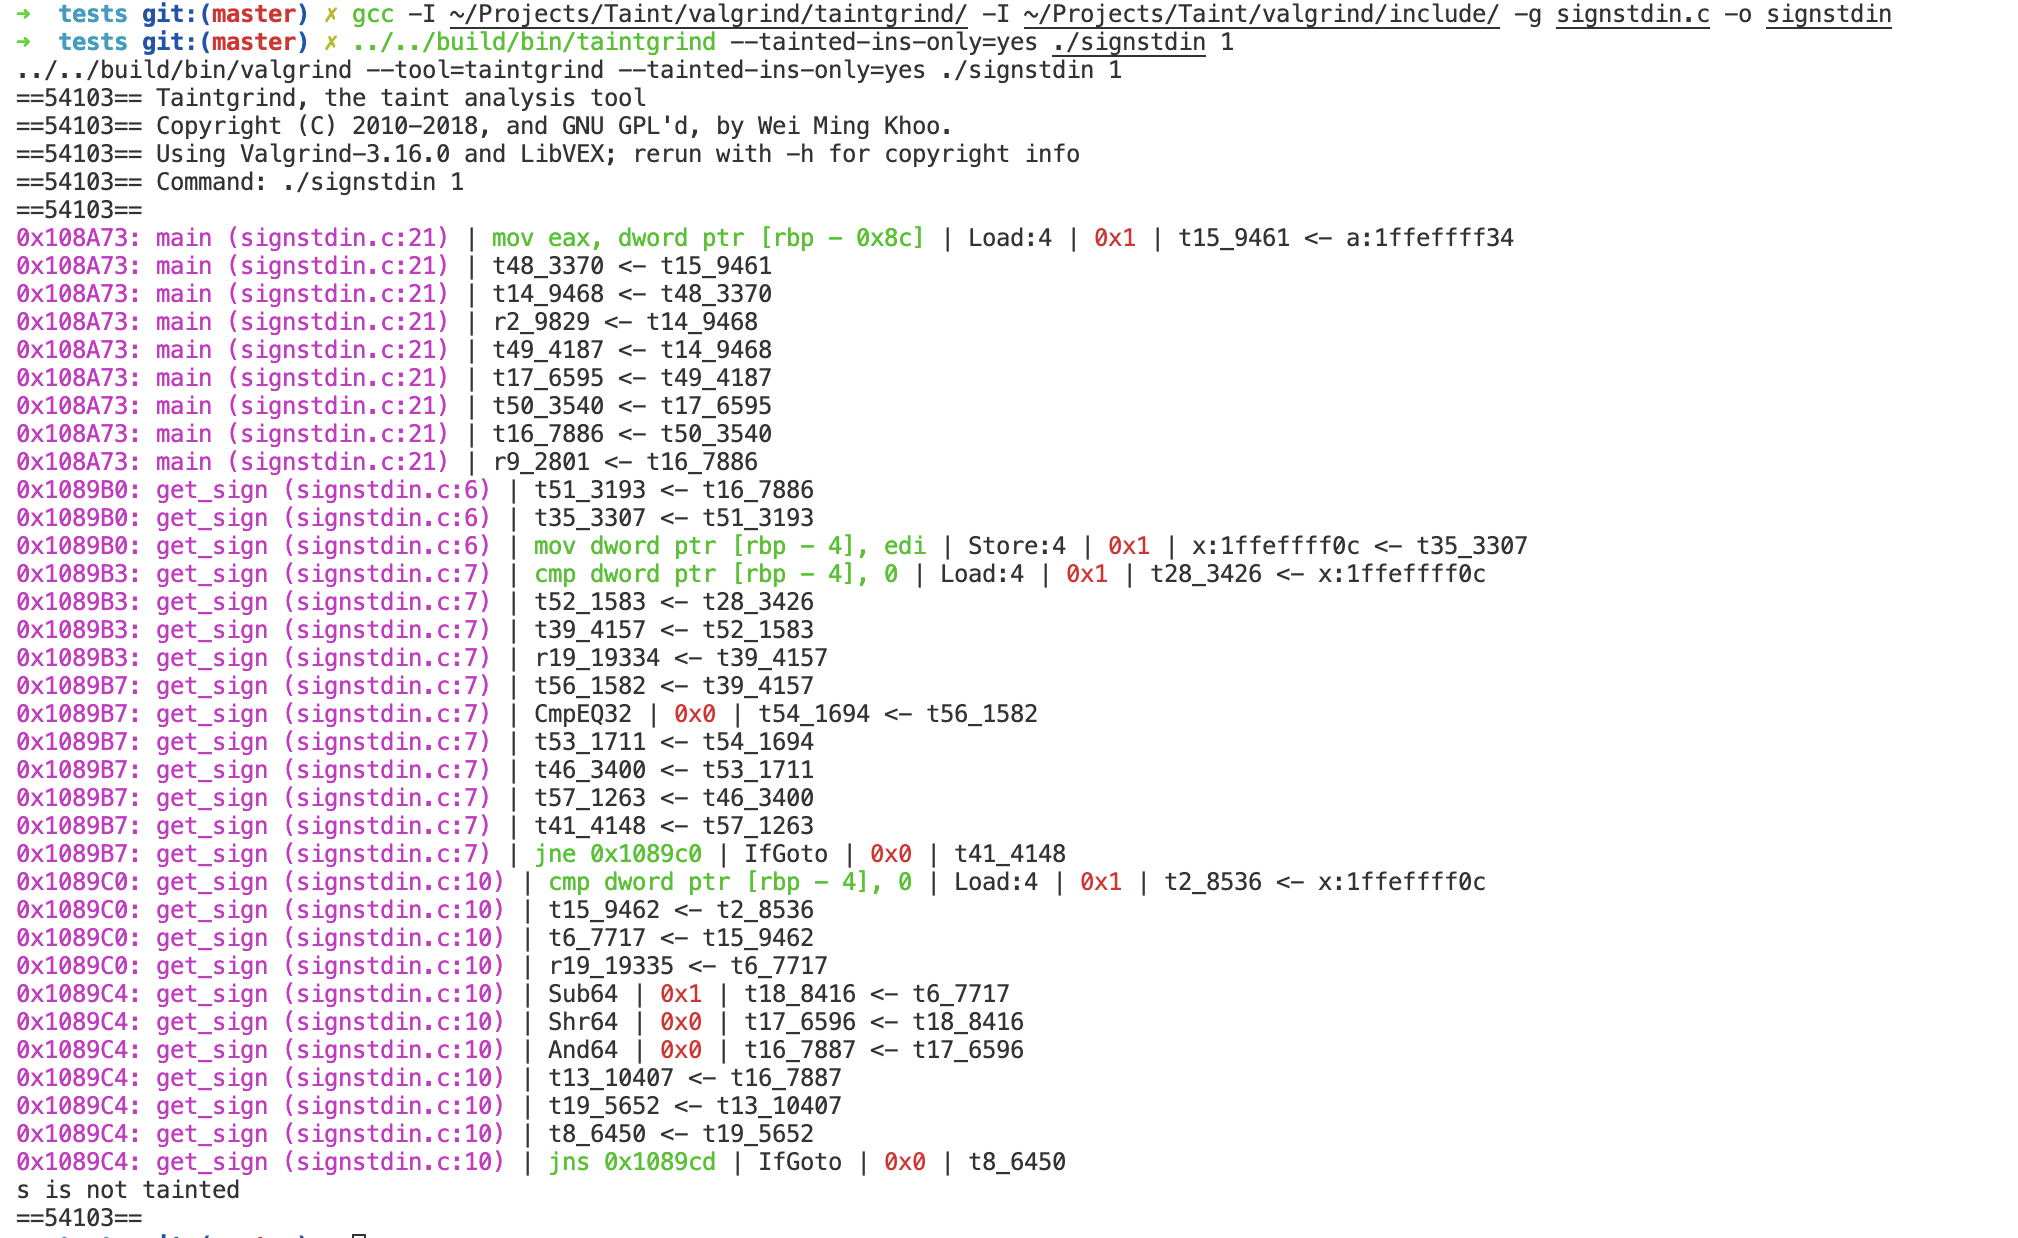
Compile the above program and run it with input 1. We check if the
return value of get_sign is tainted using the client request
TNT_IS_TAINT. The output of dynamic analysis shows how
taint flows in the execution path through instructions one by one in the
following form.
1 | Location | Assembly instruction | Instruction type | Runtime value(s) | Information flow |
However, we can see that Taintgrind does not support to analyze the implicit information flow, even though the taint has flowed into the conditional expression.
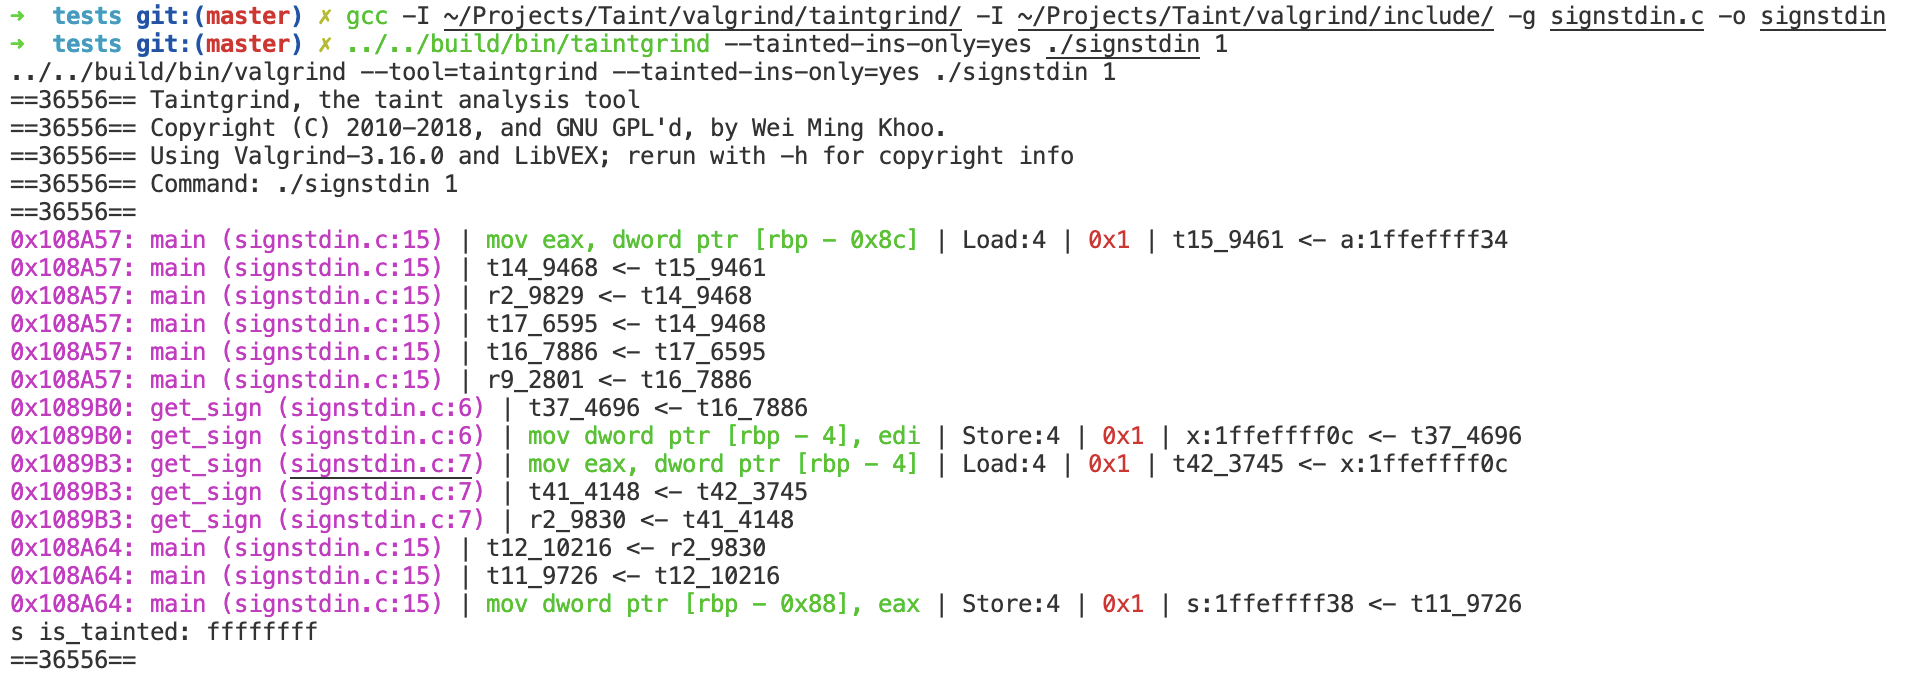
As to the explicit information flow like below, the return value of get_sign can be successfully tainted.
1 | int get_sign(int x){ |
Another usage of Taintgrind is to taint the file input given an executable, such as gzip, and show how taint flows along the execution path.
1 | ./build/bin/taintgrind --file-filter=FAQ.txt gzip -c FAQ.txt |
3. Dynamic Analysis Tool: PolyTracker
Unlike Taintgrind, PolyTracker instruments the taint analysis logic into programs during compilation to track which bytes of an input file are operated by which functions. Therefore, compared with dynamic binary instrumentation, such tools impose negligible performance overhead for almost all inputs, and is capable of tracking every byte of input at once. PolyTracker is built on the top of the LLVM DataFlowSanitizer.
PolyTrack works as LLVM Pass. The
generated shared object .so can be loaded either through
opt tool to instrument the LLVM bitcode, or through
clang when the source code is avaliable.
1 | # Through opt tool |
PolyTracker provides compilers polybuild and
polybuild++, which are wrappers around gclang
and gclang++. When the source code is avaiable, we can
instrument it by simply replacing the compiler with PolyTracker and
passing --instrument-target option before the cflags during
the normal build process.
1 | # export CC=`which polybuild` |
If only the binary executable is given, we can first extract the
bitcode from the target, then instrument it by passing
--instrument-bitcode option.
1 | get-bc -b target |
To run the instrumented program, POLYPATH environment
variable is requited to specify which input file's bytes are meant to be
tracked. Currently, polytracker only expose the capability to specify a
single file as the tainted input. Assume we have the following C
program. Given an input file, this program computes a key based on the
first three strings, then compares the key with 0x80000000,
and finally outputs the result.
1 |
|
We can find that the last string (provided_lic) is actually not used
when computing the key. Further, the three strings are only used in the
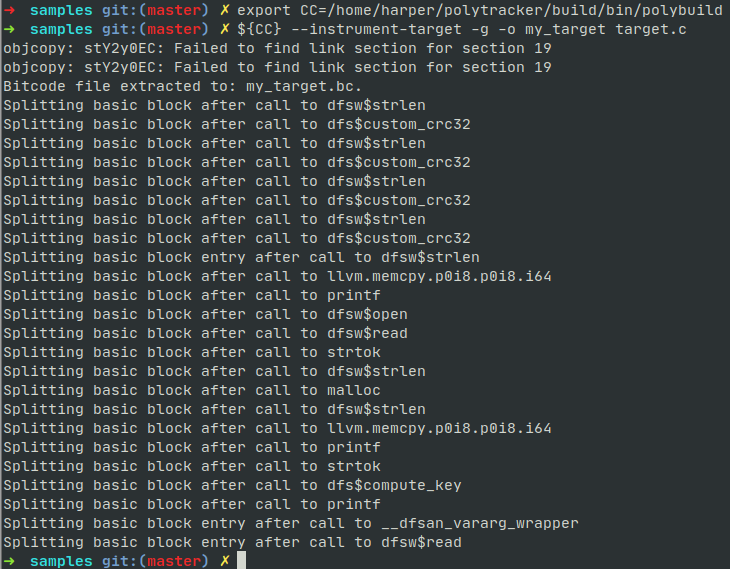
condition statement (line 25) at function custom_crc32. We compile it
using polybuild, the output shows several functions are
instrumented.
With the instrumented binary my_target,run the binary
with POLYPATH environment to taint the input file.
1 | POLYPATH=inputfile ./my_target inputfile |
The binary is executed as normal, also two artifacts
polytracker_process_set.json and
polytracker_forest.bin are created in current directory at
the same time.

The analysis results are saved
inpolytracker_process_set.json, which contains the
information of taint_sources, runtime_cfg,
tainted_function, etc. The json file generated by
my_target is shown as below:
1 | { |
Polytrack outputs function-to-input-bytes mapping to indicate which bytes of an input file are operated on by which functions and how. If an input byte flows into a function as parameter but has never been read by the function, the function will not be counted as a tainted function.
1 | void testfunc(int len, char *buf) { // not a tainted function |
Besides, Polytracker can identify whether the input bytes are used in
condition statements (listed under the key
tainted_functions/function/cmp_bytes in JSON file).
However, there are some exceptions. The following function uses the
length of buf to decide the value of a, then
returns a to its caller. Polytracker will not label this
function as tainted, even if the value of a is implicitly
depends on input buf.
1 | int testfunc(char *buf) { // not be labeled as tainted |
In fact, Polytrack is designed to be used in conjunction with PolyFile to automatically determine the semantic purpose of the functions in a parser. PolyFile is a file identification utility to parse the file structure and map each byte of the file into the corresponding semantic. Take PDF file as an example, PolyFile first identifies that the given file is in PDF format, then outputs the sematic of each byte in the file, such as PDFComment, PDFObject.
Assume we want to reverse-engineer the PDF parser MuPDF. PolyTracker is used to instrument the parser to output the associate each byte of PDF file with each function in that parser. With the file format parsed by PolyFile as ground truth, we can easily infer the sematic purpose of each function in MuPDF by merging the two mappings (function <-> input byte <-> semantic). Based on this design consideration, it's straightforward to answer why Polytracker only use function as taint sink granularity to perform analysis.
4. Static Analysis Tool but Emulate Execution: Bincat
The following keygen-me-style program takes a few arguments as command-line parameters, then generates a hash depending on these parameters, and compares it to an expected license value.

Open executable get_key_x86 in IDA Pro. We can see
address 0x93B is the start point of main function.
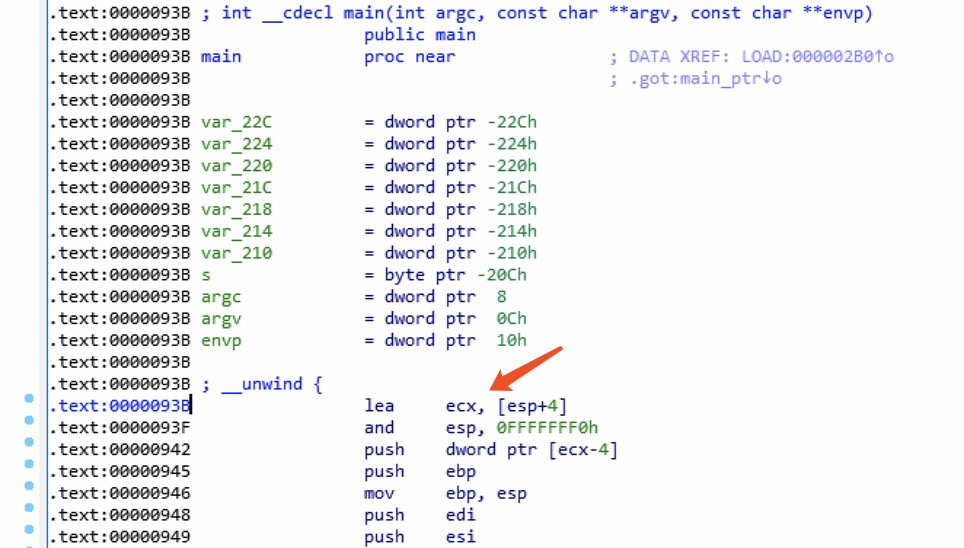
Focus on the BinCAT Configuration pane, set the
start address as 0x93B as the start address. Edit the
configuration to initialize the stack, setup the content of command-line
parameters, and corresponding memory.
1 | mem[0xb8000000*4099] = |00|?0xFF # initialize the stack to unknown value |
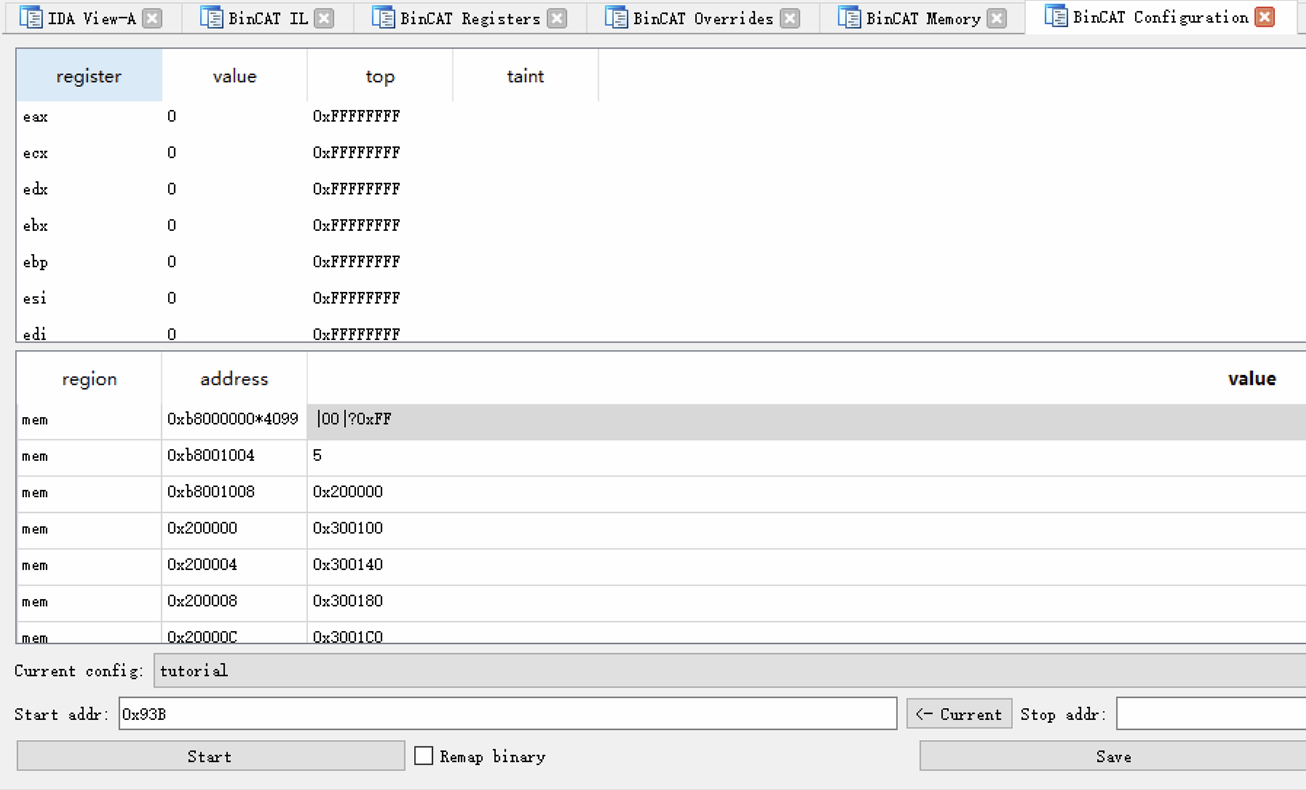
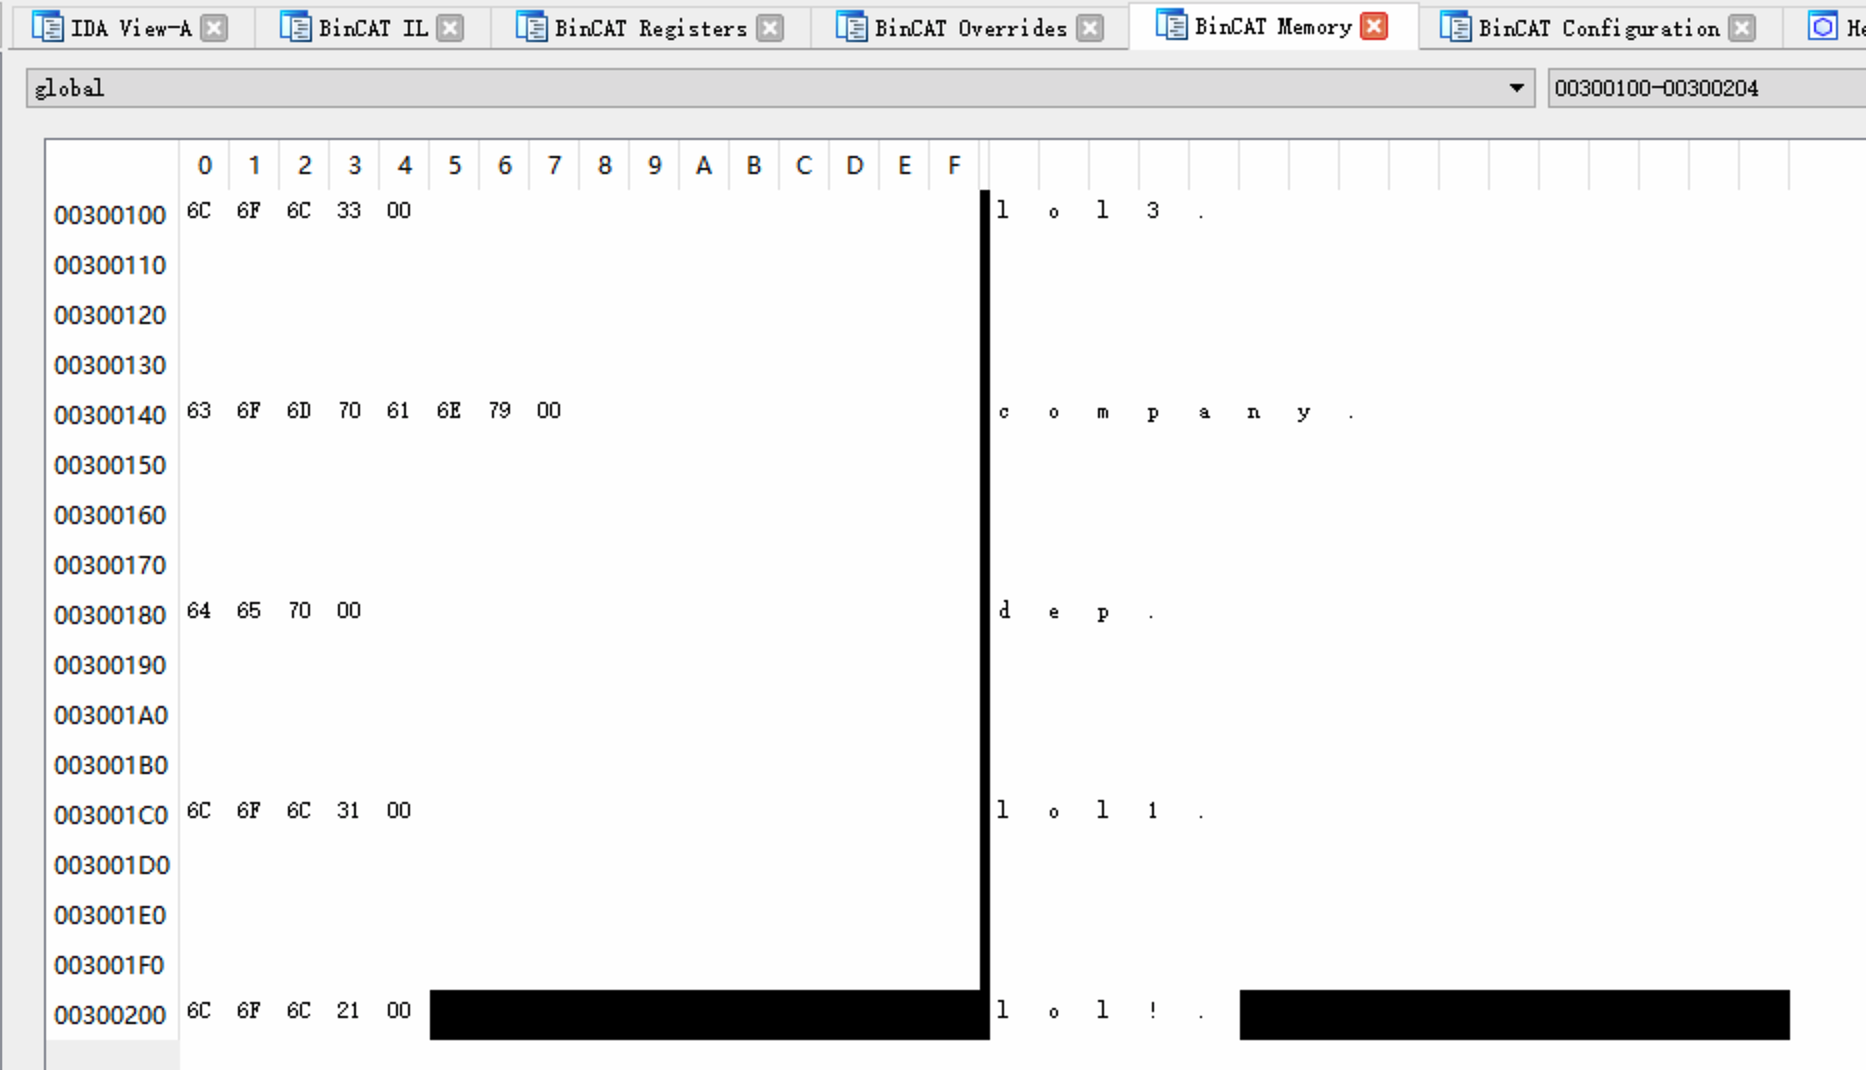
Click start to perform analysis. When analysis finishes, open the BinCAT Memory view, we can see the five parameters are located at the corresponding memory addresses.
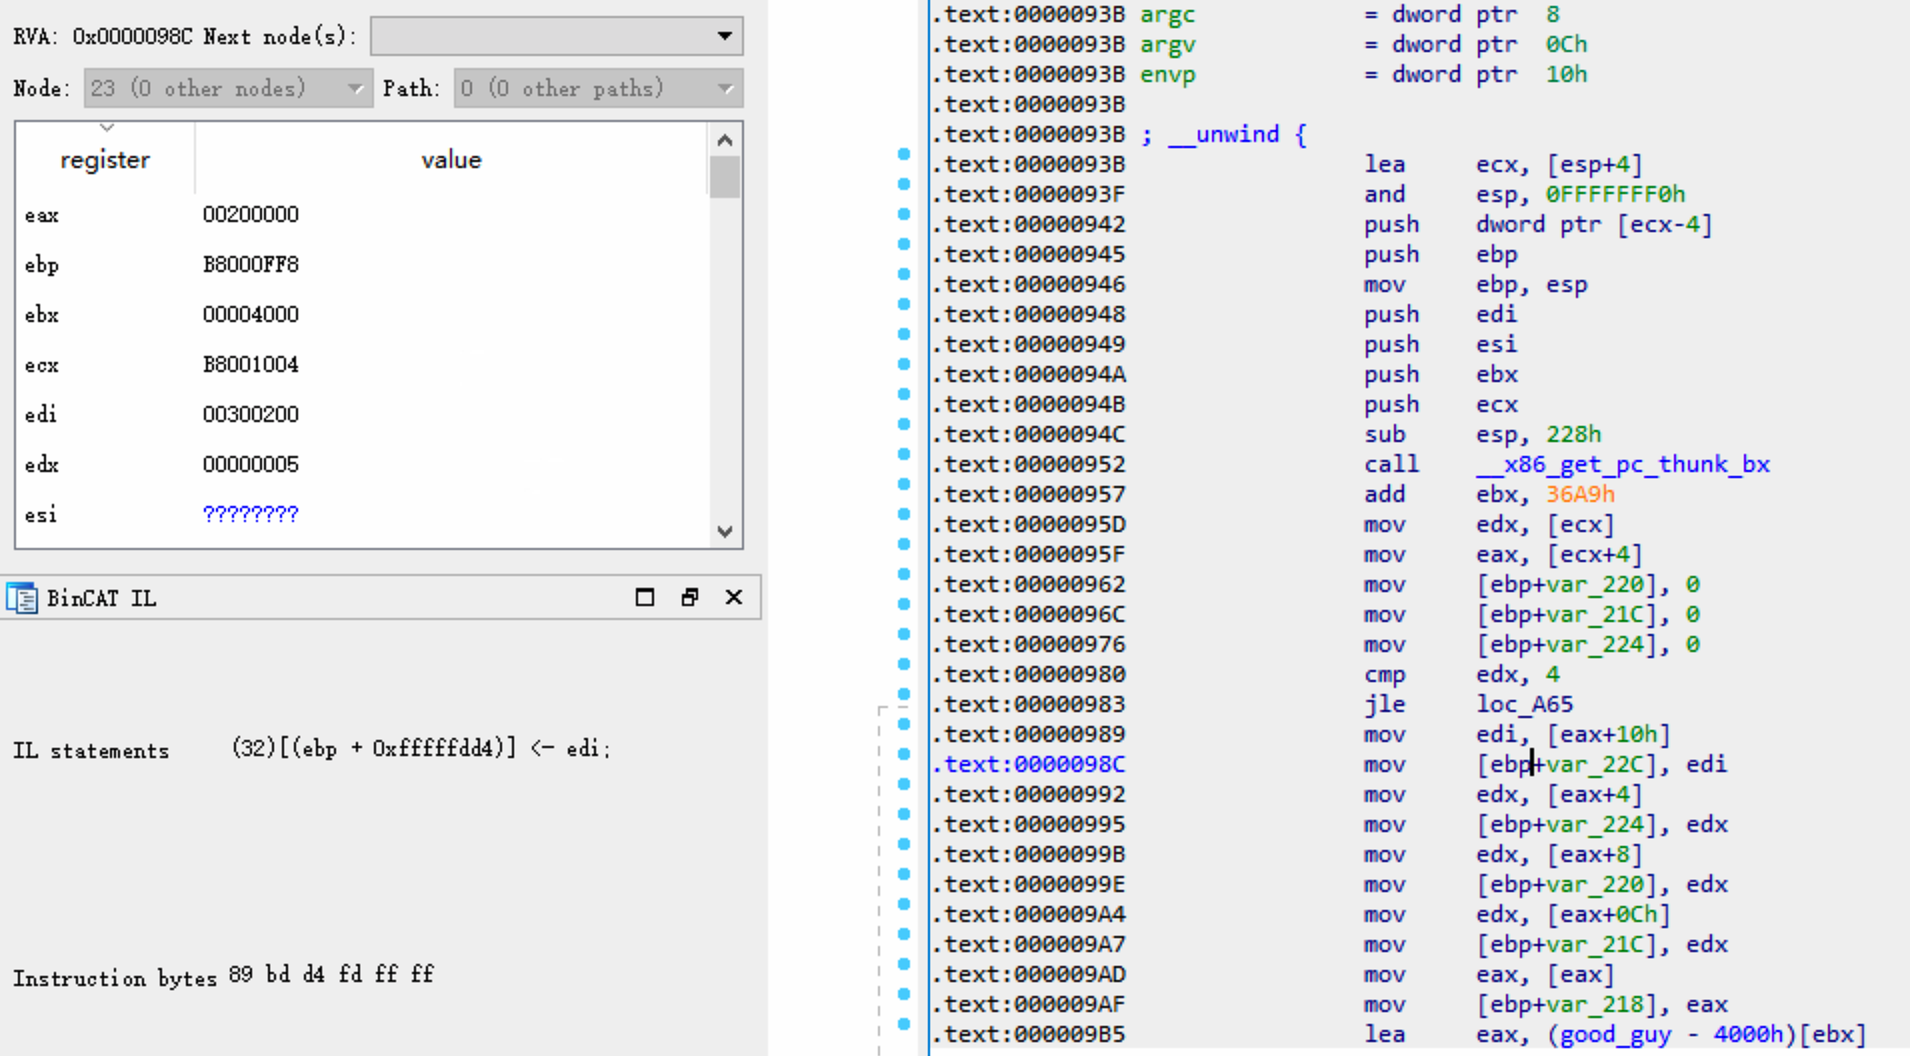
Switch to the IDA View-A view, go to an arbitrary
address such as 0x98C, we can check the value of each
register. From the BinCAT IL view, the intermediate
language of instruction mov [ebp+var_22C], edi is
(32)[ebp+0xfffffdd4]<-edi.
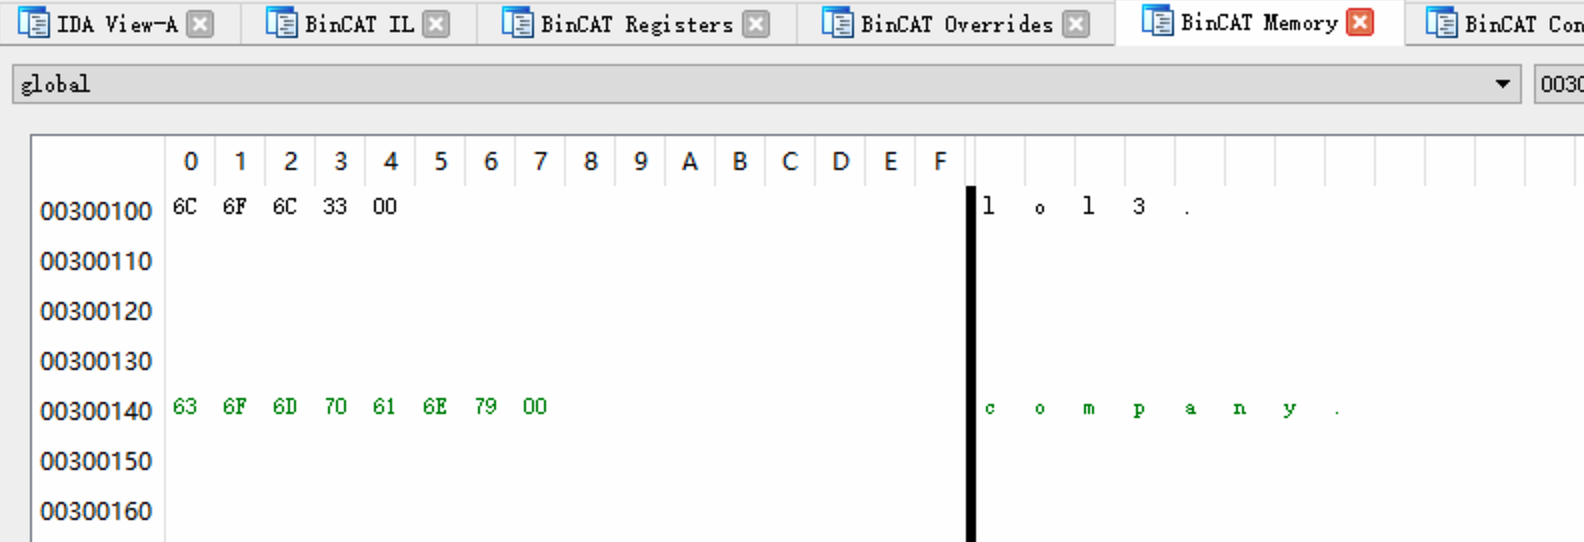
Override the taint of every byte at addresses
0x300140-0x300147 which contains the
null-terminated company string.

Set it to !|FF| (this fully taints the byte, without
changing its value).

We can check that the user-defined taint overrides at BinCAT Overrides view. Re-run the analysis.

Advance to the instruction at address 0x93F, and observe
that this memory range is indeed tainted: both the ASCII and hexadecimal
representations of this string are displayed as green text.
In the IDA View-A view, notice that some
instructions are displayed against a non-gray background, since they
manipulate tainted data. For example, the instruction at address
0x9E6 (push eax) is highlighted because
eaxis tainted.
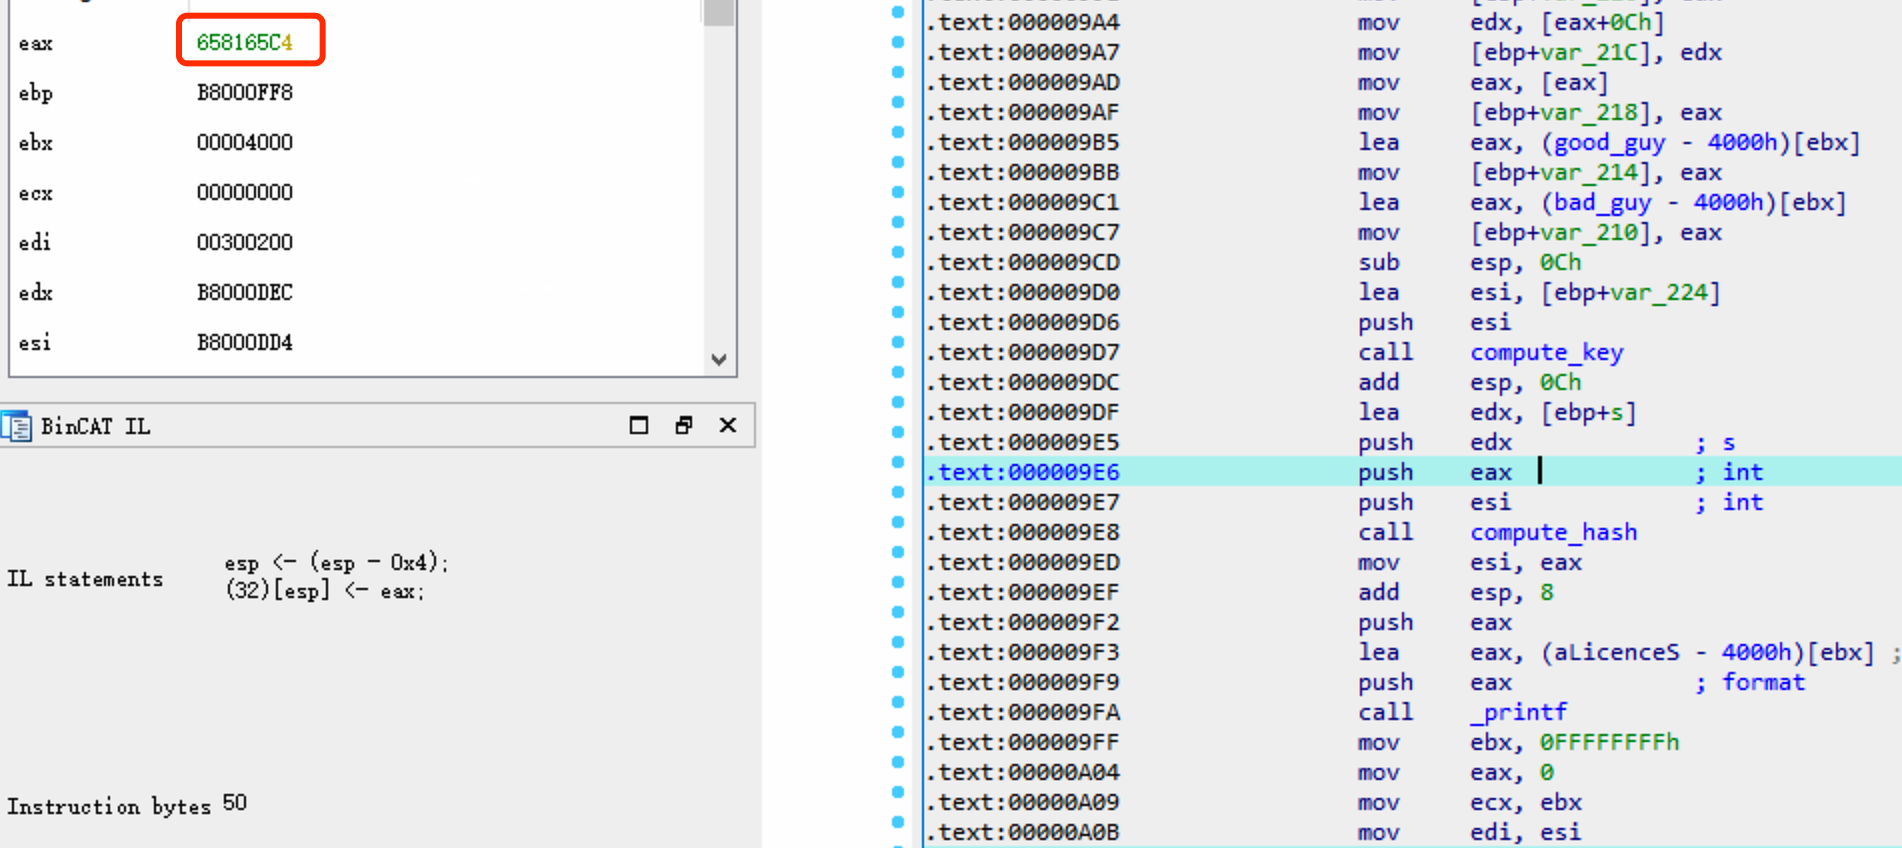
In the IDA View-A view, we can see some instructions are displayed with a white background, since these instructions are not executed with the given parameters.

5. Static Analysis Tool: Psalm
Psalm is a static analysis tool for PHP applications. Assume we plan
to analyze the following target.php program using Psalm.
$_POST is user-controlled input, which is defined as a
taint source by default. echo is the place that we don't
want untrusted user data to end up, which is also defined as taint sink
by default. In this program, the data explicitly flows from
$_POST to echo $name and implicitly from
$_POST to echo $a.
1 |
|
In the directory of the above program, run the following command to
add a psalm.xml config file.
1 | ./vendor/bin/psalm --init |
Psalm will scan the project, set the project files to be analyzed and figure out an appropriate error level for the codebase.
1 |
|
To perform taint analysis, run the ./vendor/bin/psalm
with flag --taint-analysis. However, the analysis shows
that no errors found in the target.php program.
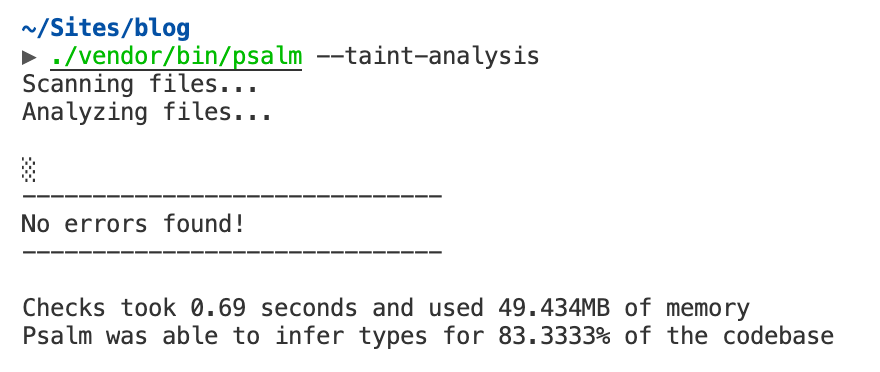
There are two reasons. First, Psalm not support implicit data flow
tracking. Second, operation stripslashes remove taints from
data because this function removes backslashes in the string, which
eliminates the risk of suffering cross-site-scripting attacks. In that
case, there is no need to track how taint flows anymore. We can feel
that Psalm is developed mainly for security analysis of web
applications. However, this is not consistent with our idea: If the
output changes with the different inputs, the output should be tainted
once the input is tainted.
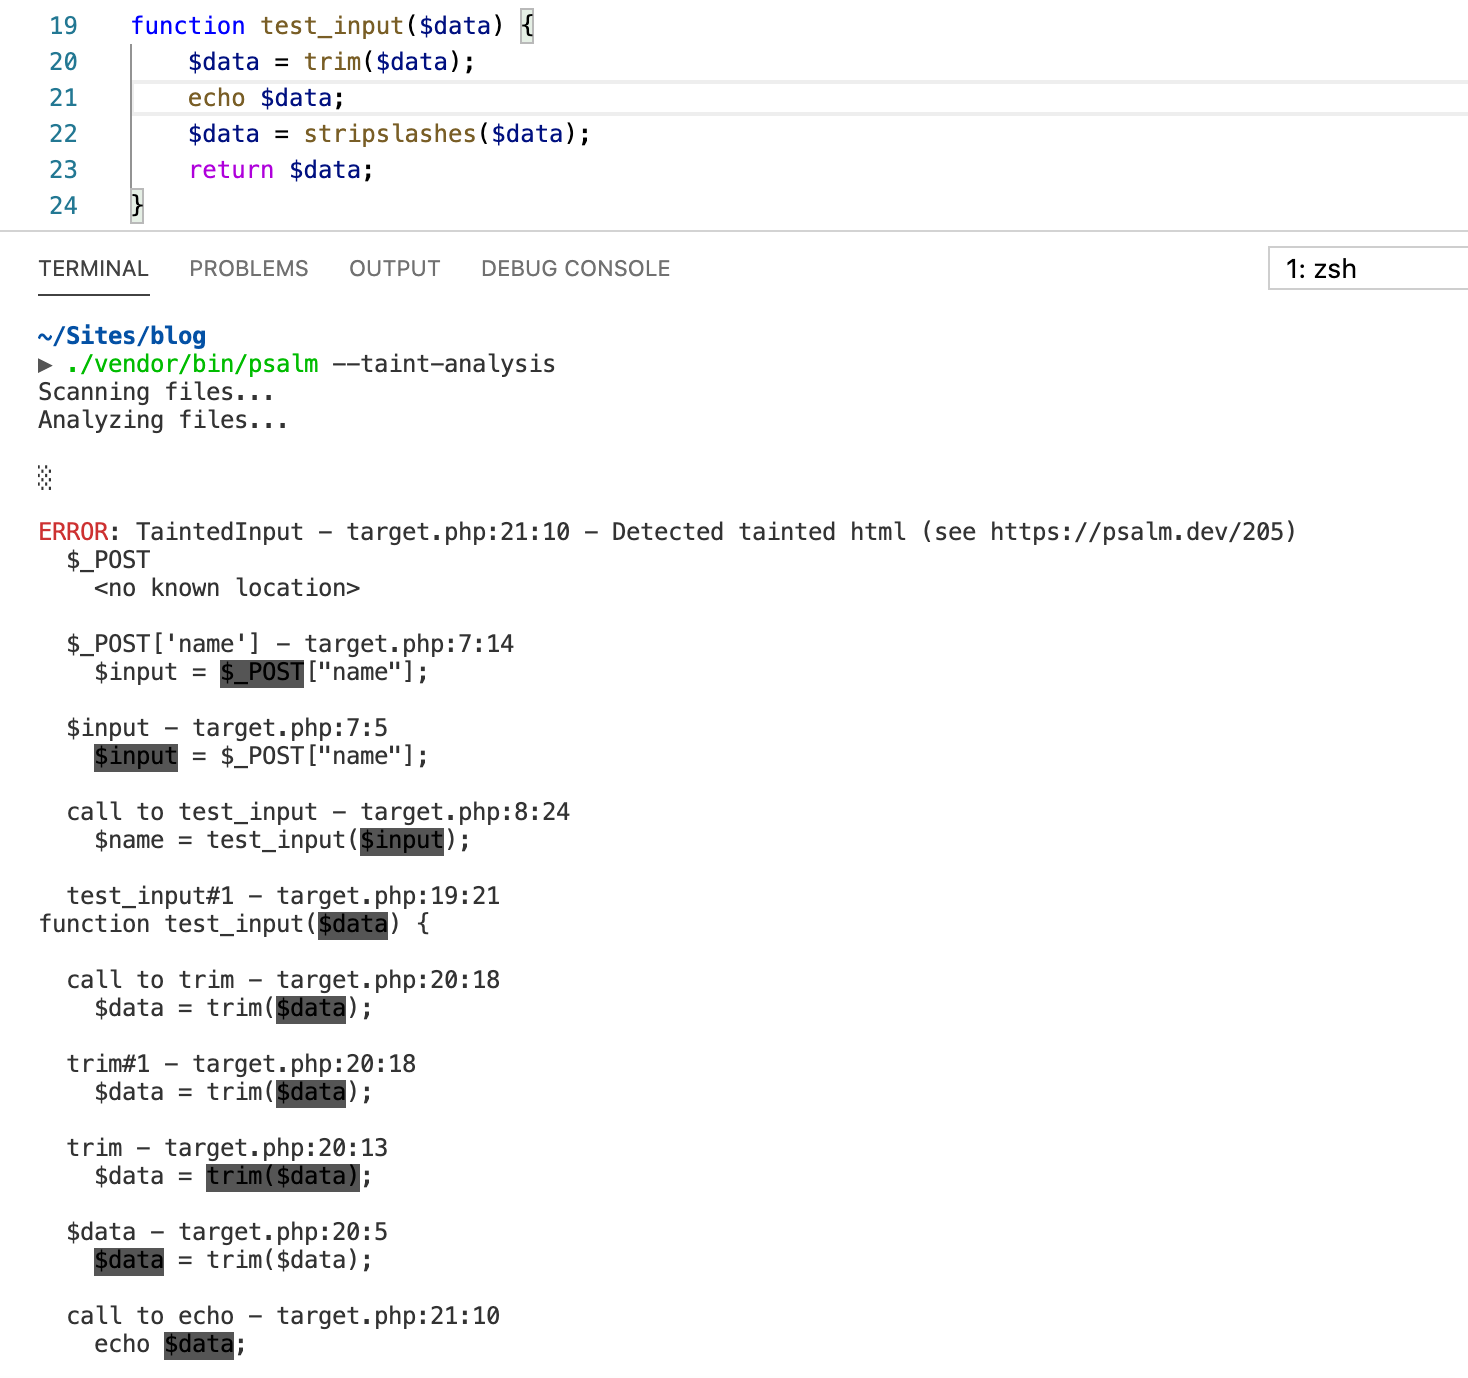
If we put echo $data ahead of stripslashes
function, the error can be detected.
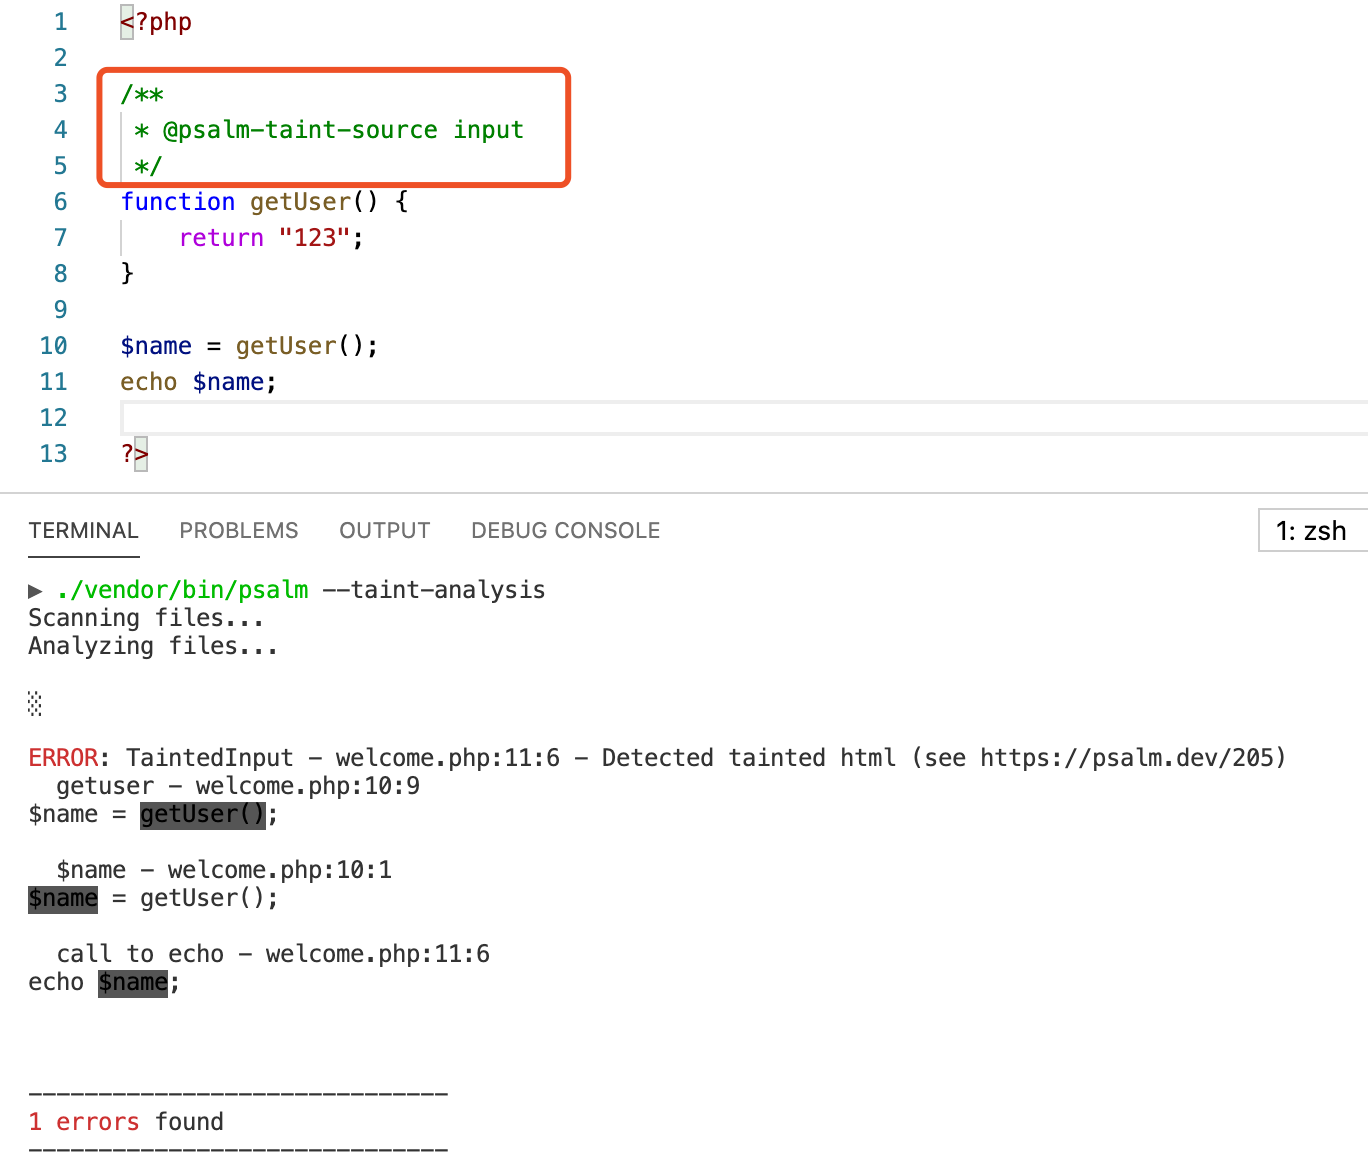
Except for the three default taint sources
$_POST/$_GET/$_COOKIE, we can define our custom taint
sources using annotations
@psalm-taint-source <taint-type>, which are always
the return value of user-controlled functions. The following example
defines the return value of getUser function as a taint
source whose type is input. When the taint flows into the
taint sink echo, an error will be reported.
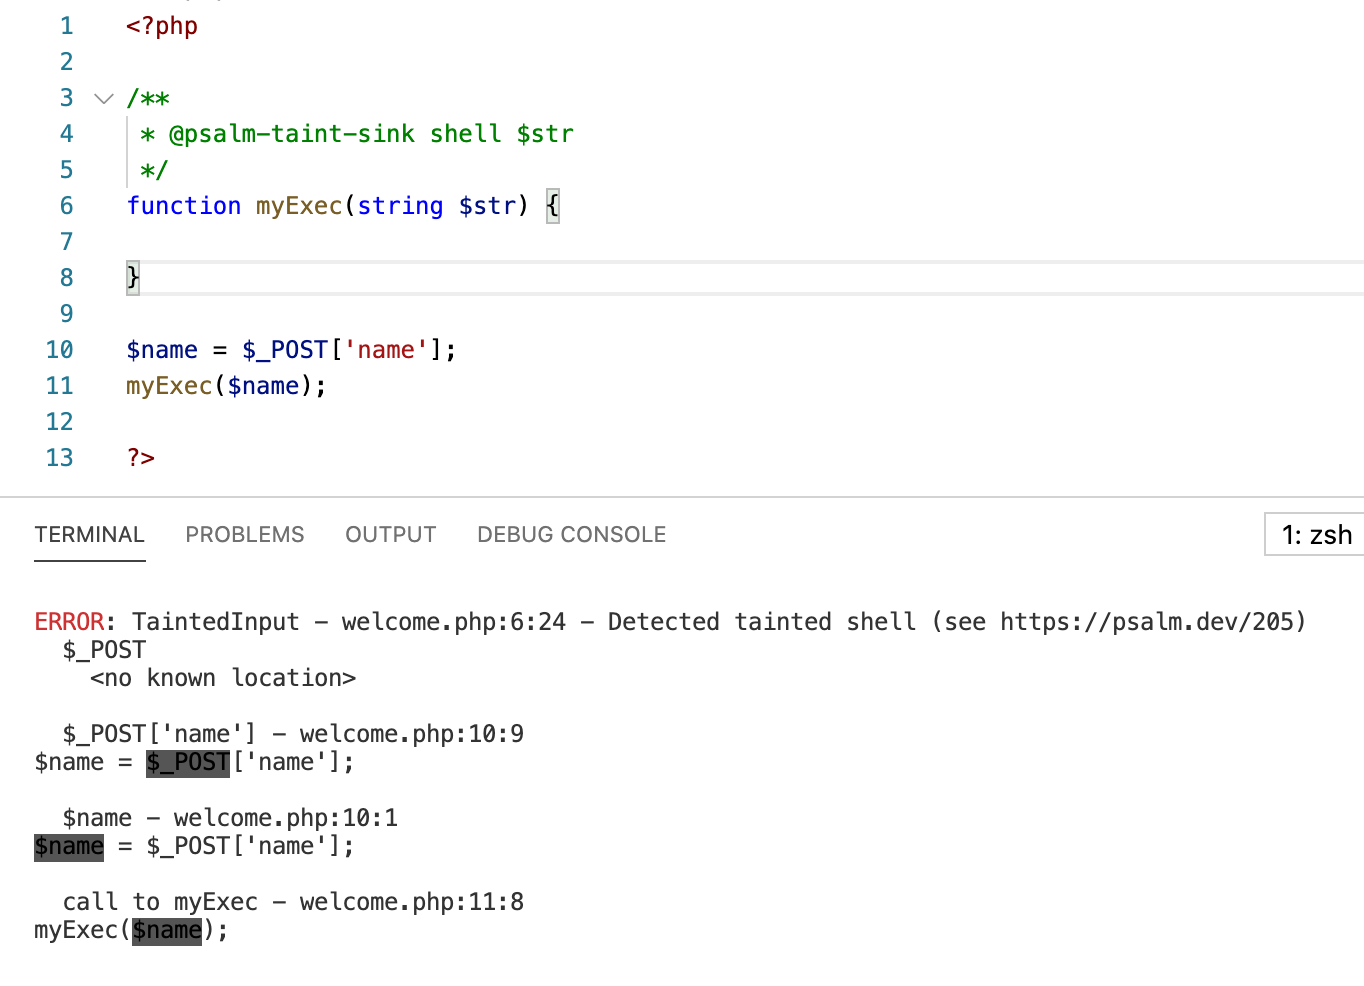
Also, except for a number of default builtin taint sinks such as
echo, we can define our custom taint sinks using annotation
@psalm-taint-sink <taint-type> <param-name>,
which are always the parameters of functions that should be carefully
treated. The following example defines the parameter $str
of myExec function as taint sink whose type is
shell.
6. Static Analysis Tool: Pysa
Pysa is a static analysis tool for python. We first define different
types of taint sources and sink in taint.config file. In
the following config, we define source type UserControlled,
sink type RemoteCodeExecution, as well as a rule showing
that we concern about the data flows from source
UserControlled to sink
RemoteCodeExecution.
1 | { |
Then we need to link the source and sink type with target program.
The following .pysa file using python annotation syntax
indicates that the return value of input is taint source
with type UserControlled, and the parameter of
print is taint sink with type
RemoteCodeExecution. Once there is a data flow path from
input to print, Pysa will report the potential
issue.
1 | # taint/general.pysa |
Therefore, for the target program, the input function is
a taint source since it gets input directly from the user. The
print function is a taint sink, since we do not want
user-controlled values to flow into it.
1 | def func(): |
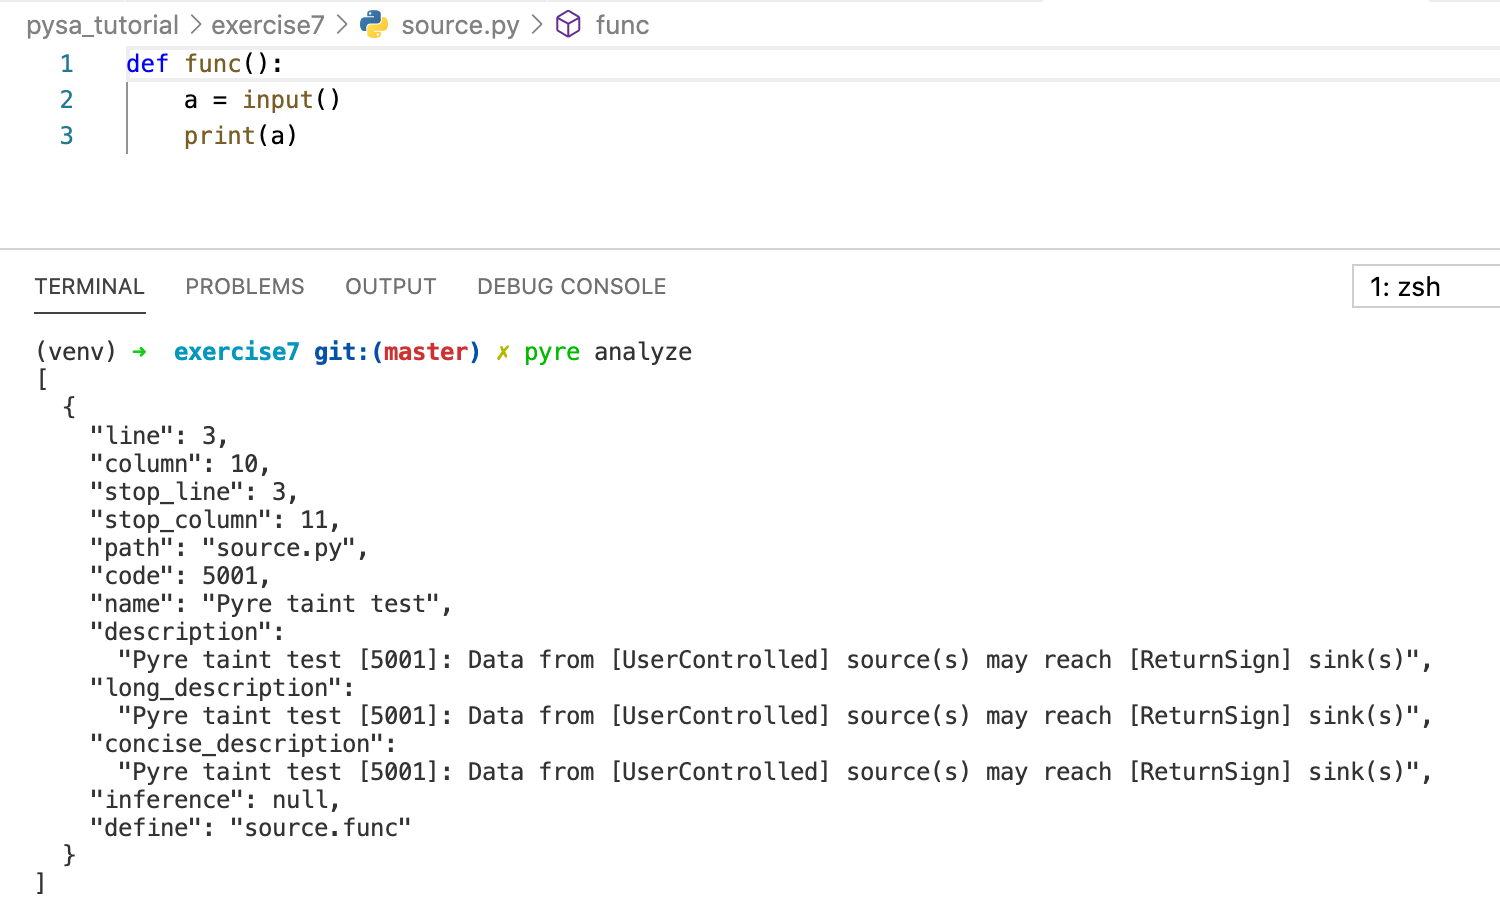
Execute command pyre analyze to perform taint analysis,
here are the results. The information shows that the taint source
a flows into sink at line 3, in which a is
used as the parameter of print function. The message also shows that the
detected issue points to function source.func. Note that
Pysa only analyzes data flow in functions, which means if the following
statement 2 and 3 are in main function or even not any
function, then Pysa will say that there is no issue.
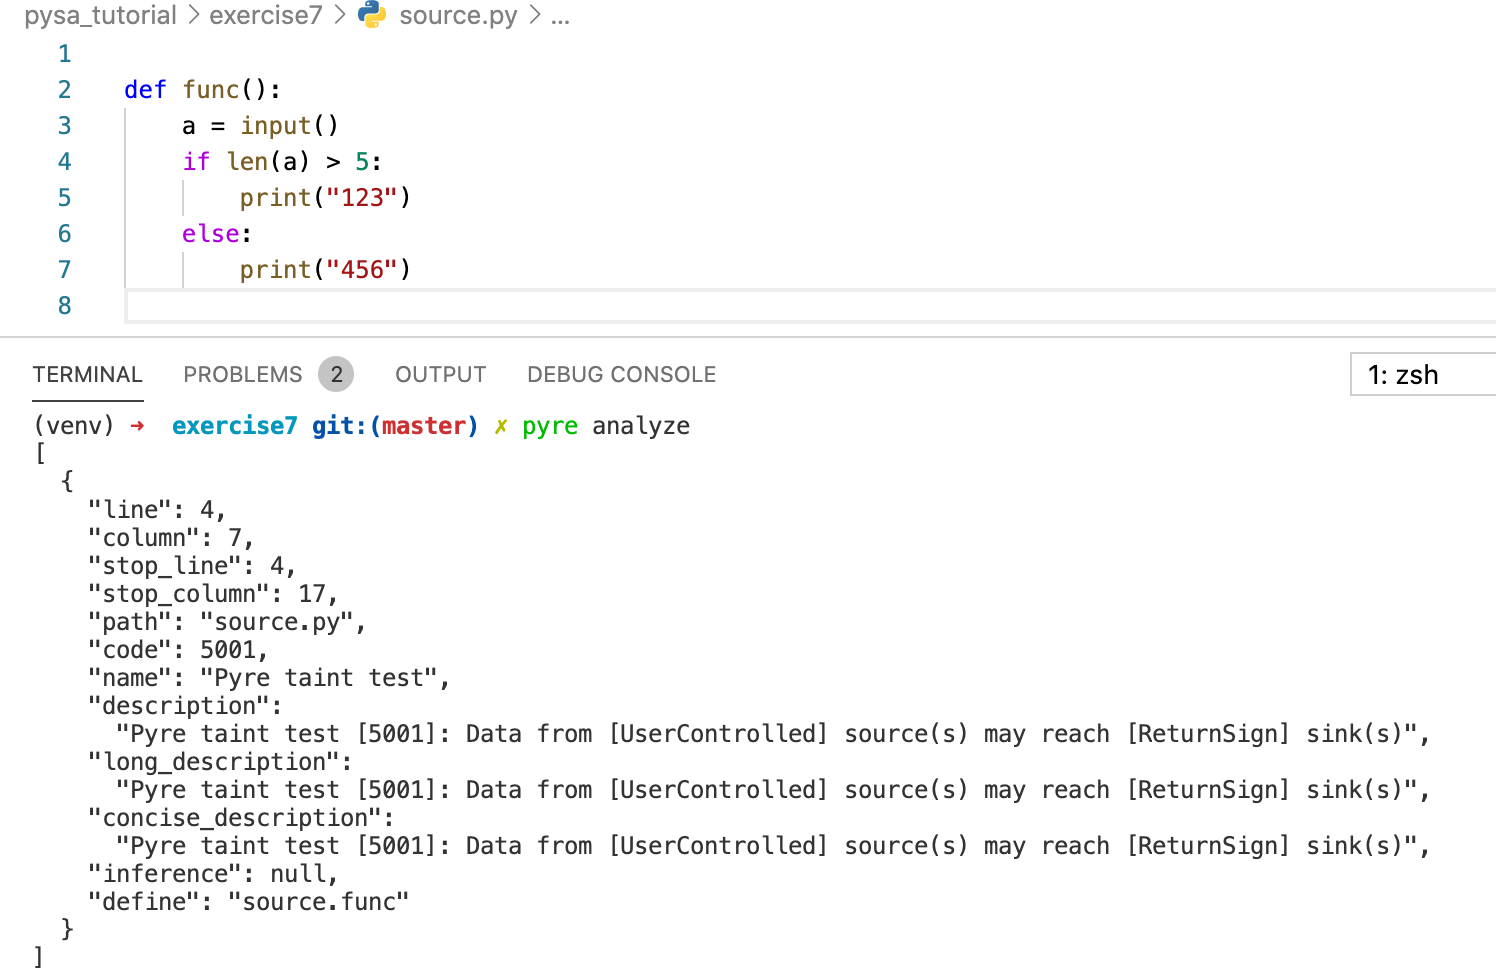
Pysa cannot track implicit information flow, currently, only
conditional tests are supported. In the following case, the taint source
a is used in conditional test expression in line 4. Pysa
can report this problem, but cannot detect that the taint has implicitly
flowed into sink print at line 5 and line 7.
7. Conclusion
We can feel that even though there are a bunch of taint analysis
tools, they are developed for different purposes, which leads to
different user interfaces, different taint granularity, different
features. We may need to be careful to infer the taint "ground truth"
based on the output of the program. Furthermore, these taint tools
prefer to under-taint and even make efforts to reduce false positive. In
details, the implicit dependence such as if(x){ y = 2; }
are not supported by majority tools. Besides, for dynamic tools and
those static tools that simulate execution, they only focus on one path
that depends on the user input. Mutations that don't affect the
information flow of that path may not be useful to test the analysis
tool. Therefore, test case construction is another aspect that should be
treated seriously.